Tufts Students Poll the 2020 Election
On October 25, 2020, Tufts University conducted a nationally representative survey of 1,215 American adults in conjunction with Professor Brian Schaffner’s “Polling the 2020 Election” seminar. The poll was conducted online with a sample of adults provided by Lucid, and it was weighted by gender, age, region, education, race, and the 2016 presidential vote to be nationally representative of likely voters. Below, we highlight notable themes discovered by Tufts undergraduate students using the polling data. You can analyze the results of the poll yourself here.
Early Voting
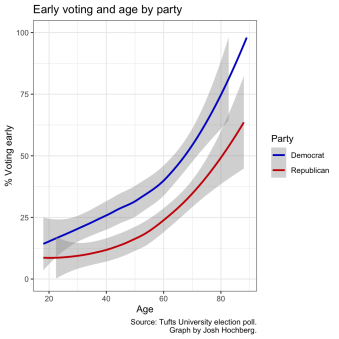
Perhaps due to the serious health risk posed to the elderly by voting in-person on election day, we are seeing that older voters are much more likely to report having voted early, either via mail-in ballot or early in-person voting, compared to younger voters. However, there is strong partisan polarization among whether people are voting early. Across all ages, Republicans are less likely to report having voted early than Democrats. This is consistent with general patterns of early voting, although it may be exacerbated by President Trump's criticism of mail-in ballots.
—Josh Hochberg, A22 | Major: Political Science | Twitter: @jshochberg99
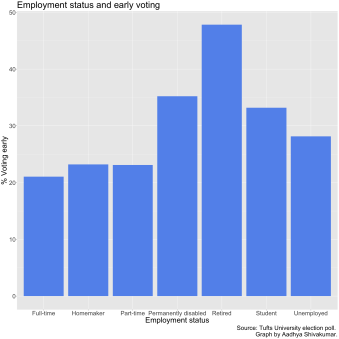
The percentage of individuals who have voted early differs markedly between different employment statuses. Approximately 47% of retired voters have voted early thus far, while less than a quarter of voters who are employed full time have done so. These results are perhaps due to the time constraints of a typical workday, which may prevent employed individuals from voting early.
—Aadhya Shivakumar, A22 | Majors: Political Science & Psychology | Twitter: @aadhyashiv
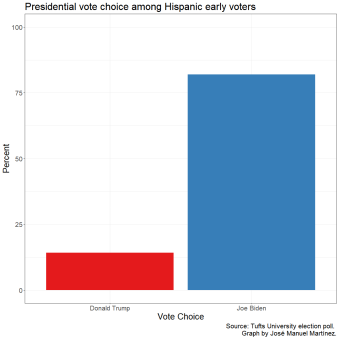
Based on everything I have seen on the news, most outlets were saying that Joe Biden is doing worse than Hillary Clinton among Hispanic voters. I wanted to see if this was the case, so I used data of Hispanic voters who have already voted either through absentee or early voting. In my graph, it demonstrates that, among Hispanic voters who have already cast their ballots, 81.92% have voted for Joe Biden and 14.16% have voted for Donald Trump. So far, Biden is doing way better than Clinton (66%) did in 2016 and could outpace Obama's (71%) numbers from 2012. Even though this only takes into account absentee and early voting, which favor Democratic candidates, it shows how Biden's moderate stances are resonating with the diverse electorate of Hispanic voters. With the Hispanic electorate becoming more involved every election cycle, it is interesting to see how they are projected to vote in 2020, especially with key battleground states, such as Texas, Florida, and Arizona, being toss-ups. Even if Hispanics are voting in favor of the Democratic candidate right now, the media speaks truthfully of how this electorate can vary, from Conservative Cubans to Liberal Mexicans Americans, and the role they will play in future elections.
—José Manuel Martínez, A22 | Majors: Political Science and Civic Studies | Twitter: @rep_martinez
Comparing 2020 to 2016
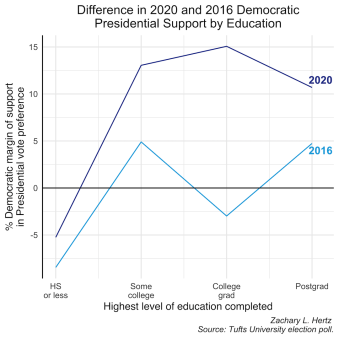
Biden enjoys stronger support than Clinton had in 2016 across all educational demographics, though the effects of this boost are moderated somewhat by a smaller yet still substantial increase in support for the president. As in 2016, the president’s strongest group remains white voters without a college degree. As a result, Biden’s increases on the Clinton 2016 margin are smallest among those without a college degree and particularly pronounced among college graduates.
—Zachary Lorico Hertz, A19 | Twitter: @ZacharyLHertz
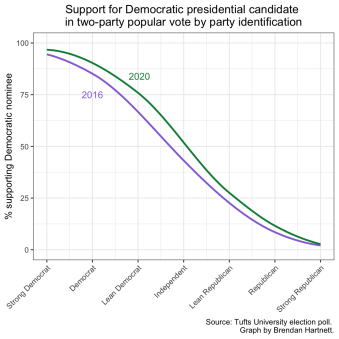
The Lincoln Project and the “Republican Voters Against Trump” political initiative by Defending Democracy Together have worked to undermine Trump’s re-election campaign by arguing for traditional Republicans to support Joe Biden. These efforts, as well as an economic recession, the COVID-19 pandemic, and social movements for racial equality, have stifled Trump’s support, particularly among independents and those who lean slightly to either the Democratic or Republican party. With the exception of those who identify as strong Republicans, Biden is supported to a greater extent than Clinton was in 2016 within the two-party system across all party identifications.
—Brendan Hartnett, A23 | Majors: Political Science & Sociology | Twitter: @BrendanHartnett
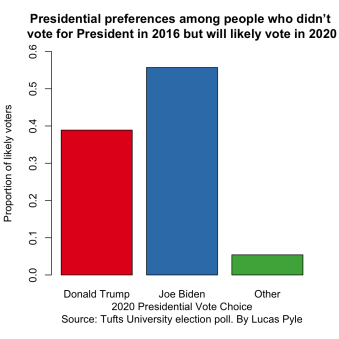
This graph looks at voters who did not vote for President in the 2016 Presidential Election and who they plan to vote for in the 2020 Presidential Election. The graph uses data from the Tufts University election poll and has been weighted for likely voters, meaning that the graph is representative of people who did not vote for President in 2016 but are likely to vote in the 2020 election. The graph shows that 56% of voters who did not vote for President in 2016 but are likely to vote in the 2020 election are going to vote for Joe Biden, while 39% of these voters will vote for Donald Trump. The 56% and 39% include people who have already voted for these candidates, will vote for these candidates, or are leaning towards voting for these candidates. 5% of voters who did not vote for President in 2016 but are likely to vote in the 2020 election are voting for another candidate, undecided in their vote choice, or will not vote for a President. This data shows that Joe Biden has gathered more support from those who did not vote for President in 2016, giving him an advantage in this year's election.
—Lucas Pyle, A21 | Majors: Political Science & Religion | Twitter: @Lucasbenji17
Racial Attitudes in 2020
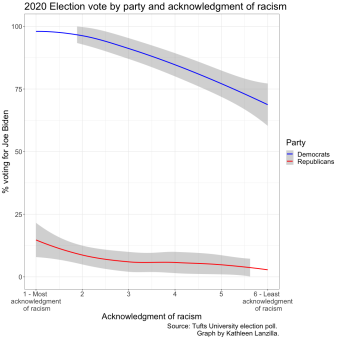
Beyond the difference in support for Joe Biden amongst likely voters that we would expect to see by party, there is a noticeable change in those voting for Biden dependent upon their degree of acknowledgment of racism. This can be seen more clearly amongst the Democratic Party; over 90% of those who were the most acknowledging of racism are voting for Biden, compared to less than 75% of those who were the least acknowledging of racism. While a slight negative correlation can be seen with Republican voters, less than 25% are voting for Biden, regardless of their acknowledgment of racism.
—Kathleen Lanzilla, A21 | Majors: Political Science & Education
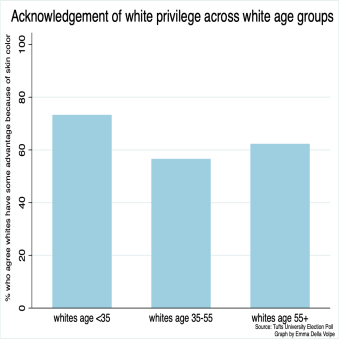
Often we think of the acknowledgement of societal inequalities, such as white privilege, to be generational. Younger Americans are expected to be more likely to recognize such disparities. When analyzing the agreement of white age groups with the notion that white people in the U.S. have advantages because of the color of their skin, we found white voters under 35 significantly more likely to agree. While white voters over 35 still acknowledge the notion of “white privilege,” the gap between agreement and disagreement narrowed.
—Emma Della Volpe, A21 | Major: Political Science with a minor in Urban Studies | Twitter @emmadellavolpe
Swing Voters?
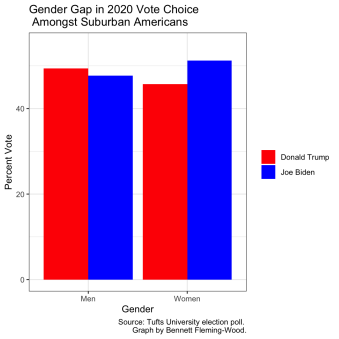
Trump's favorability amongst suburban women has been a point of curiosity in the 2020 election, with some saying Trump is losing the votes of suburban women who supported him in 2016. The following figure shows that suburban women are over 5 points more likely to support Biden than Trump in the upcoming election, with over 51% supporting the Democratic nominee and only around 46% supporting the incumbent President. Suburban women are also 3 points less supportive of Trump and 3 points more likely to vote for Biden than suburban men. There is a slight but clear gender gap among suburban Americans, with suburban women favoring Biden over Trump.
—Bennett Fleming-Wood, A21 | Majors: Political Science; Twitter: @bennettfw36
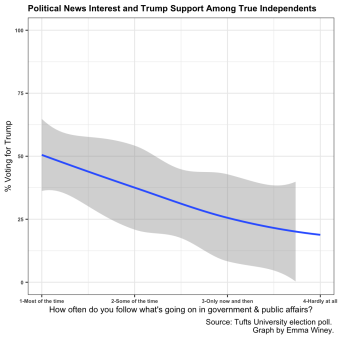
Given the razor-thin margins of victory in recent American elections, persuading true Independent voters (Independents who do not claim to lean toward either the Democratic or Republican Parties) to support a certain candidate could be enough to swing a key battleground state, and thus swing an election. Among these true Independent voters, we see a notable correlation between support for Trump in the 2020 election and their interest in following current events in government and public affairs. The more someone follows current events happening in the American government, the more likely they are to support Donald Trump for re-election. Meanwhile, those who are uninformed on current political news are less likely to vote for Trump.
—Emma Winey, A22 | Majors: Political Science | Twitter: @ewiney8
Ideology and Partisanship
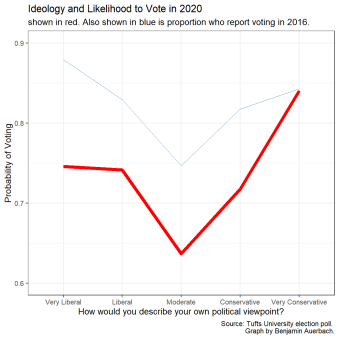
Extreme conservatives are most likely to vote and moderates are least likely to vote. We can see that the red line is the average probability a respondent will vote given their self-reported ideology. A moderate in our survey, then, has about a 64% chance of voting, while someone who calls themselves "very conservative" has an 84% chance of voting on November 3rd. This may seem unsurprising; moderates tend to be less politically engaged and for the "very conservatives," Trump is their guy. What is most interesting to me, though, is that the "very liberals" and the "liberals" have about the same likelihood of voting (about 75%). Perhaps this fits with Joe Biden being perceived as a more moderate choice by voters, which could depress excitement among "very liberals" or increase it among "liberals." While not a direct comparison, I provided the blue line showing (reported) voting in 2016, which presents a relationship where the "very liberals" were more likely to vote, and the disparity between the conservatives was less pronounced. Perhaps in 2016, Hillary Clinton was seen as the more extreme choice, while in 2020 it is Trump.
—Benjamin Auerbach, A21, Majors: Political Science & History | Twitter: @bnarbac
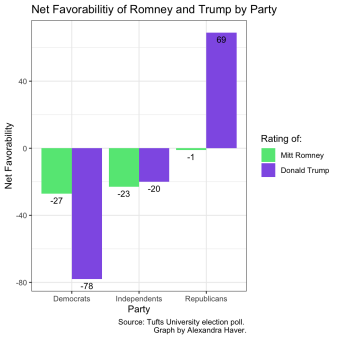
This graph shows the net favorability ratings for Mitt Romney and Donald Trump among respondents of each major party. Independents who lean Democratic or Republican were grouped in with those respective parties, not with other Independents. Trump's net favorability is very low among Democrats, moderately low among Independents, and very high among Republicans. Romney, an establishment Republican who has sometimes voiced opposition to Trump, has moderately low net favorability ratings among both Democrats and Independents, and neutral favorability among Republicans.
—Alexandra Haver, A21 | Major: Political Science
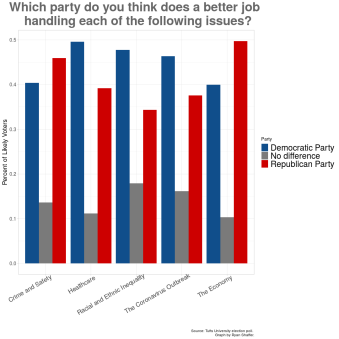
Among likely voters, Democrats are seen as doing a better job than Republicans on the issues of healthcare, racial and ethnic inequality, and the coronavirus outbreak. Republicans are seen as doing a better job than Democrats on the economy and crime and safety. Important to note is that Democrats’ strongest issue is healthcare, while Republicans’ is the economy -- which are two of the top three issues this election cycle. The coronavirus outbreak is the other top issue.
—Ryan Shaffer, A21 | Major: Political Science
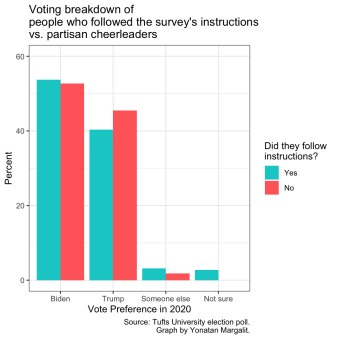
In a section that asked people to compare the two parties on their handling of different issues (i.e. economy, healthcare, coronavirus, etc.), one of the issues was not an actual issue. Rather, it was an attention check that just asked people to select the option "No difference," with "Democratic Party" and "Republican Party" being the other two options. Just over 13% of people did not do what they were asked, and instead chose one of the two parties – quite an astounding number seeing as the people who failed the other two attention checks were coded out of the data frame. The percentage of people who support Biden marginally decreases when going from those who followed instructions to those who did not. Conversely and more substantially, the percentage of people who support Trump increases when going from those who followed instructions to those who did not.
—Yonatan "Tuna" Margalit, A22 | Major: Political Science | Twitter: @tunadahuman